


Abstract
The hydraulic architecture and water relations of fruits and leaves of Capsicum frutescens were measured before and during the fruiting phase in order to estimate the eventual impact of xylem cavitation and embolism on the hydraulic isolation of fruits and leaves before maturation/abscission.
Measurements were performed at three different growth stages: (1) actively growing plants with some flowers before anthesis (GS1), (2) plants with about 50 % fully expanded leaves and immature fruits (GS2) and (3) plants with mature fruits and senescing basal leaves (GS3). Leaf conductance to water vapour as well as leaf and fruit water potential were measured. Hydraulic measurements were made using both the high-pressure flow meter (HPFM) and the vacuum chamber (VC) technique.
The hydraulic architecture of hot pepper plants during the fruiting phase was clearly addressed to favour water supply to growing fruits. Hydraulic measurements revealed that leaves of GS1 plants as well as leaves and fruit peduncles of GS2 plants were free from significant xylem embolism. Substantial increases in leaf petiole and fruit peduncle resistivity were recorded in GS3 plants irrespective of the hydraulic technique used. The higher fraction of resistivity measured using the VC technique compared with the HPFM technique was apparently due to conduit embolism.
The present study is the first to look at the hydraulics of leaves and fruits during growth and maturation through direct, simultaneous measurements of water status and xylem efficiency of both plant regions at different hours of the day.
INTRODUCTION
Changes in the partitioning of the hydraulic resistances among the different organs of a plant (often referred to as ‘plant hydraulic architecture’, Zimmermann, 1978) provide information on changes in plant water balance and growth rates (Sperry, 2000; Tyree and Zimmermann, 2002; Lo Gullo et al., 2004). About half of the hydraulic resistance of a plant is thought to reside in the transport system that drives water from soil to leaves (the xylem; Tyree and Zimmermann, 2002). This system is extraordinarily complex and far for being completely understood (Zwieniecki and Holbrook, 2009).
Xylem consists of a living component associated with water-conducting elements (Esau, 1977). The hydraulic resistance of xylem parenchyma is finely regulated by aquaporin gating (Javot and Maurel, 2002; Chaumont et al., 2005), which is sensitive to environmental signals such as water and nutrient availability (Wan et al., 2004), light and temperature (Sakr et al., 2003; Lee et al., 2009). The hydraulic resistance of xylem conduits has been thought for many decades to change on a seasonal basis as the result of ontogenetic changes of conduit dimensions that are known to be under hormonal control and influenced by water availability (e.g. Aloni and Zimmermann, 1983; Aloni and Stuart, 1991). Since the early studies on xylem cavitation, however, it has become clear that xylem hydraulic resistance can vary as a consequence of conduit embolism (Tyree and Sperry, 1989; Sperry and Pockman, 1993; Sperry et al., 2003) and more recent works suggest that embolized conduits can be restored to their functional state through active mechanisms mediated by vessel-associated cells and involving phloem (De Boer and Volkov, 2003; Alves et al., 2004; Salleo et al., 2004; Zwieniecki and Holbrook, 2009). On the basis of the above, plant hydraulics can be expected to vary largely during growth and development, especially during the fruiting phase because fruits are strong sinks for nutrients and water (e.g. Ho, 1992; Valantin et al., 1999; Nobel and De la Barrera, 2000; Bota et al., 2004) and their growth depends on both xylem and phloem efficiency. The sink strength of growing fruits may require them to develop lower water potentials than stems and leaves (e.g. Johnson et al., 1992; Berger and Sellers, 1993; Greenspan et al., 1996; Guichard et al., 1999) so as to favour inward water flows. This idea, however, is in contrast to other studies where no direct correlation was found to exist between fruit water status and sink strength (e.g. Van Zyl, 1987; Nobel et al., 1994; Nobel and De la Barrera, 2000; Borràs et al., 2003). Most of the above studies, however, have not reported direct measurements of vascular flows or simultaneous recordings of leaf and fruit water potentials at different times of the day.
During fruit ripening, plant-to-fruit connections are progressively interrupted but the sequence of events leading to functional separation of ripe fruits from the parent plant is still poorly understood (Findlay et al., 1987; Greenspan et al., 1996; Malone and Andrews, 2001; Keller et al., 2006). In particular, some studies have reported evidence for differential contribution of xylem and phloem to fruit hydration during growth and ripening, with xylem functionality progressively declining (Findlay et al., 1987; Ho et al., 1987; Dichio et al., 2003; Drazeta et al., 2004) and phloem contributing more than 80 % to fruit hydration after veraison in grape berries and other species (Greenspan et al., 1996; Dichio et al., 2003; Drazeta et al., 2004; Zhang et al., 2004). Similarly to the case of senescing leaves (Salleo et al., 2008), the increase in xylem hydraulic resistance during fruit development may be due to xylem failure at or near the abscission zone in the fruit peduncle (Greenspan et al., 1994; Lang and Ryan, 1994; André et al., 1999; Van Ieperen et al., 2003) or at the pedicel-to-fruit junction as reported by Malone and Andrews (2001). The progressive hydraulic isolation of fruits has been interpreted as stimulating phloem unloading while preventing fruits from undergoing diurnal fluctuations of water potential (Van Ieperen et al., 2003). More recent studies, however, suggest that in several species xylem functionality is maintained until harvesting (Bondada et al., 2005; Keller et al., 2006; Morandi et al., 2007; Chatelet et al., 2008a, b; Choat et al., 2009) and the measured increase in xylem hydraulic resistance is not related to xylem occlusion or disruption (Tyerman et al., 2004; Bondada et al., 2005; Keller et al., 2006; Tilbrook and Tyerman, 2008). Although the hydraulic architecture of fruiting plants is certainly variable among species, the physical or biochemical nature of hydraulic isolation of ripening fruits remains a matter of debate.
The present study represents an attempt to monitor xylem functionality and check the hydraulic resistances of fruits and leaves of plants of Capsicum frutescens (hot pepper) before and during the fruiting phase with the purpose of investigating the eventual similarity between the hydraulics of fruit and leaf before maturation/abscission and, more specifically, the contribution of xylem cavitation and embolism to the impairment of water supply in leaf petioles and fruit peduncles.
MATERIALS AND METHODS
Plant material and growth conditions
Experiments were conducted on 50 plants of Capsicum frutescens L. (F1 hot pepper, Technisem, Longué-Jumelles, France) during summer 2008. The preceding May, seeds were germinated in trays (one per tray) in a greenhouse at ambient light and air temperatures. Two weeks after germination, seedlings were transferred to 3-L pots (one per pot) filled with a mixture (1 : 1 v/v) of peat and sand and were grown in the open in the campus of the Faculty of Sciences, University of Messina (sea level, north-east-facing). Air temperatures and relative humidity were measured at pre-dawn and midday using a porometer (see below) at 5 cm from the leaves. The two variables ranged between 25 ± 2 and 36 ± 3 °C and between 61 ± 5 and 40 ± 7 % at pre-dawn and midday, respectively. All plants were kept well watered throughout the study period by irrigating soil to field capacity three times per week. Plants were fertilized twice with 1·5 L of a solution containing 0·36 g L−1 ammonium nitrate, 0·3 g L−1 diammonium phosphate, 0·6 g L−1 potassium sulfate and 0·25 g L−1 Sequestrene R (Ciba Geigy, Basel, Switzerland). Three growth stages were selected for measurements: (1) actively growing plants with some flowers before anthesis (growth stage 1, GS1); (2) plants with about half fully expanded leaves and immature, green fruits (growth stage 2, GS2); and (3) plants with red mature fruits and senescing basal leaves (growth stage 3, GS3). Plant height (h), stem diameter at the base (ϕ), mean leaf surface area (AL) and total leaf surface area (ΣAL) as measured for GS1, GS2 and GS3 plants are reported in Table 1.
Plant height (h), stem diameter at the base (ϕ), mean leaf surface area (AL) and total leaf surface area (ΣAL) as measured in plants of Capsicum frutescens at three selected growth stages (GS1, GS2, GS3, see text)
| h (cm) | ϕ (cm) | AL (cm2) | ΣAL (cm2) | |
|---|---|---|---|---|
| GS1 | 23·68 ± 2·45a | 0·31 ± 0·04a | 7·77 ± 2·45a | 155 ± 13a |
| GS2 | 30·85 ± 3·87b | 0·46 ± 0·09b | 9·21 ± 2·02b | 295 ± 63b |
| GS3 | 29·03 ± 3·04b | 0·52 ± 0·07b | 9·78 ± 2·51b | 306 ± 59b |
| h (cm) | ϕ (cm) | AL (cm2) | ΣAL (cm2) | |
|---|---|---|---|---|
| GS1 | 23·68 ± 2·45a | 0·31 ± 0·04a | 7·77 ± 2·45a | 155 ± 13a |
| GS2 | 30·85 ± 3·87b | 0·46 ± 0·09b | 9·21 ± 2·02b | 295 ± 63b |
| GS3 | 29·03 ± 3·04b | 0·52 ± 0·07b | 9·78 ± 2·51b | 306 ± 59b |
Means are given ± s.d. (n = 10 for h, ϕ and ΣAL; n = 100 for AL). Different letters indicate significant differences for Tukey's pairwise comparisons (P < 0·001).
Leaf gas exchange and water status of leaves and fruits
Leaf conductance to water vapour (gL) was measured on two leaves per plant from five plants at each growth stage studied using a steady-state porometer (LI 1600, LiCor Inc., Lincoln, NE, USA). Leaf water potential (ΨL) and fruit water potential (ΨF) were measured using a portable pressure chamber (3005 Plant Water Status Console, Soilmoisture Equipment Corp., Goleta, CA, USA) on at least five leaves and five fruits from different plants per growth stage. Measurements were made at pre-dawn (0500 h) and midday (1200–1300 h). Five expanding leaves at about 85 % of final surface area (GS1), five fully expanded leaves and five fruits (GS2, GS3) from different plants were measured for water potential isotherms (P‐V curves; Tyree and Hammel, 1972; Salleo, 1983) to determine the water potential at the turgor loss point (ΨTLP) and osmotic potential at full turgor (Ψπ0).
Hydraulic measurements
Hydraulic measurements were made using both the HPFM (high-pressure flow meter; Tyree et al., 1995) and the vacuum chamber (VC) technique (Kolb et al., 1996). The rationale for repeating measurements using the two techniques was that pressures applied when using the HPFM (see below) cause all xylem conduits to be filled with water so that the increase in hydraulic resistance eventually caused by xylem embolism cannot be recorded using the HPFM instrumentation. By contrast, the VC technique allows measurement of the impact of this common xylem status (Nardini and Salleo, 2000). On the basis of the above considerations, the two techniques were compared for leaves, petioles and fruit peduncles (see below).
HPFM measurements


VC measurements
The vacuum chamber technique (Kolb et al., 1996; Nardini et al., 2001) has proved to be an effective tool for measuring actual R of different plant organs, including changes due to conduit cavitation and embolism (e.g. Lo Gullo et al., 2003; Trifilò et al., 2003). The vacuum chamber was an 8-L PVC flask. At least ten leaves per growth stage (GS1, GS2, GS3) were cut off from different plants under distilled filtered water and connected to rigid PEEK tubing using a 5-mm length of 1·5-mm i.d. Tygon tubing. The PEEK tubing passed through the rubber seal of the vacuum flask to a beaker of solution (25 mm KCl) resting on a digital balance (Ohaus Explorer, Nänikon, Switzerland). Preliminary experiments were made comparing Rleaf as measured during perfusion with 25 mm KCl or with distilled water. The two fluids gave similar results. The KCl solution was preferred for VC measurements for consistency with analogous measurements of petioles and peduncles, where the use of distilled water has proved to overestimate hydraulic resistance (Gascò et al., 2006).
A vacuum pump was used to reduce the pressure in the flask in steps of 20 kPa and at each pressure a computer recorded the weight of the beaker on the digital balance at 60-s intervals to compute flow. All flow readings were made at a temperature of 22 ± 2 °C. At least 20 flow readings were made at each pressure, ranging from atmospheric pressure to depressions of 20 kPa each in four steps starting from 80 kPa below atmospheric pressure and continuing at 60, 40 and 20 kPa. Volume flow rates were recorded until the flow became stable (i.e. the standard deviation of the mean of the last ten readings was less than 3 % of the mean). The flows (F) were plotted versus the absolute pressures applied (P) and leaf hydraulic conductance (Kleaf = 1/Rleaf) was computed from the slope of the F–P linear relationship. The leaf blade was removed and R was measured again, giving the hydraulic resistance of the petiole (Rpetiole = 1/Kpetiole). A similar procedure was used to calculate Rpeduncle. The hydraulic resistance of the whole fruit was impossible to measure because fruits had no stomata (see below) and flows were minimal. Therefore, single fruits were first connected to the apparatus. The fruit was then removed at the fruit-to-peduncle junction and Rpeduncle was measured. Rleaf was scaled by leaf surface area (AL) as measured at the end of experiments using a leaf area meter (LI-3000A, LiCor Inc.) while Rpetiole and Rpeduncle were scaled by length (see above) to give their hydraulic resistivity. All measurements were made at ambient irradiance (PAR < 20 µmol m−2 s−1).
To estimate the eventual loss of leaf vein functionality, ten leaves measured for Rleaf using the VC technique (GS1, GS2 and GS3) were infiltrated with a 2 % aqueous solution of Phloxine B (Sigma Aldrich, St. Louis, MO, USA), which has been successfully used to stain the functional vein network of both fully hydrated and water-stressed leaves (e.g. Salleo et al., 2003; Raimondo et al., 2007). Leaves were infiltrated with the dye using the vacuum chamber set at a pressure of 60 kPa above vacuum for 40 min. Preliminary experiments had shown that this time interval was sufficient to achieve complete infiltration of functional veins. After dye perfusion, leaf images were acquired with a scanner connected to a computer. Four leaf regions with a surface area of 100 mm2 each were randomly selected on both sides of the midrib and the density of the functional (red-stained) veins was recorded as total length of stained (functional) veins per unit leaf surface area (functional vein density, FVD, mm mm−2). Images were processed using SigmaScan Pro 5·0 (SPSS Science, Chicago, IL, USA).
Anatomical measurements
After hydraulic measurements, five petioles and five peduncles per growth stage were cross-sectioned and observed under a microscope to measure total number and internal diameters of xylem conduits, from which the cross-sectional potentially conductive area was calculated as Σπr2 (where r is the conduit radius). All samples were first fixed in FAA (formalin/acetic acid/ethanol, 0·05 : 0·05 : 1, v/v), washed in distilled water, hand cross-sectioned at their middle plane using fresh razor blades and stained with HCl and 1 % (w/v) phluoroglucin. Sections were observed under a microscope (Laborlux S, Leitz GmbH, Stuttgart, Germany) connected to a PC via a digital camera (Leica Camera AG, Solm, Germany; Lo Gullo et al., 2007). Digital images were analysed with the Sigma Scan Pro software package Version 5·0 (Aspire Software International, Ashburn, VA, USA).
Ten fruits per growth stage were selected to check the presence of stomata in the pericarp. A thin layer of a solution of 8 % celloidin in a 2 : 1 (v/v) mixture of ether/alcohol (Carlo Erba, Milan, Italy) was applied to different regions of the fruit surface (Ambrico et al., 2002; Lo Gullo et al., 2007). After the film became solid, it was stripped off after immersion of the fruits in a beaker containing warm, distilled water and mounted on a slide while still in water. Stomata were absent in the fruit pericarp at both growth stages studied (GS2 and GS3).
Statistics
Data were analysed with the SigmaStat 3·1 (SPSS) statistics package. One-way ANOVA was used to test differences between experimental groups. Tukey's test was used to make post-hoc pairwise comparisons between all means. The statistical significance of correlations between parameters was tested by the Pearson product moment correlation.
RESULTS
At the time of experiments, GS1 plants were actively growing with about half of the leaves still expanding and new foliage produced (Table 1) so that at plant maturity (GS2), ΣAL was increased three-fold. After this growth stage, plant height, stem diameter, mean AL and ΣAL remained constant and only fruits proceeded to ripening.
Leaf gas exchange (gL, Fig. 1) at midday was around 250 mmol m−2 s−1 during GS1 and GS2 and decreased by about 25 % concurrently with fruit ripening (GS3). As expected for well-irrigated plants (see above), pre-dawn leaf water potentials were between –0·1 and –0·21 MPa (Fig. 2A) and corresponding gL values were as low as 45–50 mmol m−2 s−1 (Fig. 1). At midday, ΨL of GS1 and GS2 plants decreased to –0·8 to –0·95 MPa (Fig. 2B). The isotherms of leaf water potential (Table 2) showed that leaves of plants at all the three growth stages studied were within the turgor zone (ΨTLP was –1·12 ± 0·08 MPa for GS1, –1·13 MPa for GS2 and –1·10 MPa for GS3) with ΨL of GS3 plants occasionally beyond the turgor loss point. Fruits maintained constant water potentials (ΨF) of –0·6 MPa throughout the study period (Fig. 2A, B) irrespective of the time of measurement. Note that ΨF was substantially more negative than ΨL when measured pre-dawn whereas it was 0·2–0·35 MPa less negative than ΨL in the warmest hours of the day. On the basis of the P–V curves (Table 2), fruits were fully turgid at any time of the day and at the two growth stages studied in that their ΨTLP was about –1·6 MPa versus actual ΨF of –0·6 MPa. Moreover, osmotic potentials at full turgor of fruits were 40 % more negative than those of leaves (Ψπ0 of fruits was about –1·3 MPa versus –0·8 MPa for leaves, Table 2).
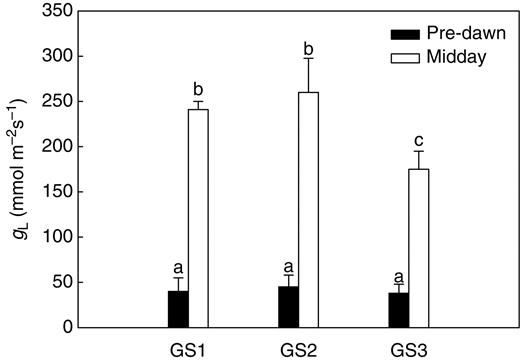
Leaf conductance to water vapour (gL) as measured at pre-dawn and midday on plants of Capsicum frutescens at three selected growth stages (GS1, GS2, GS3, see text). Means are given ± s.d. (n = 10). Different lower-case letters indicate significant differences for Tukey's pairwise comparisons (P < 0·001).
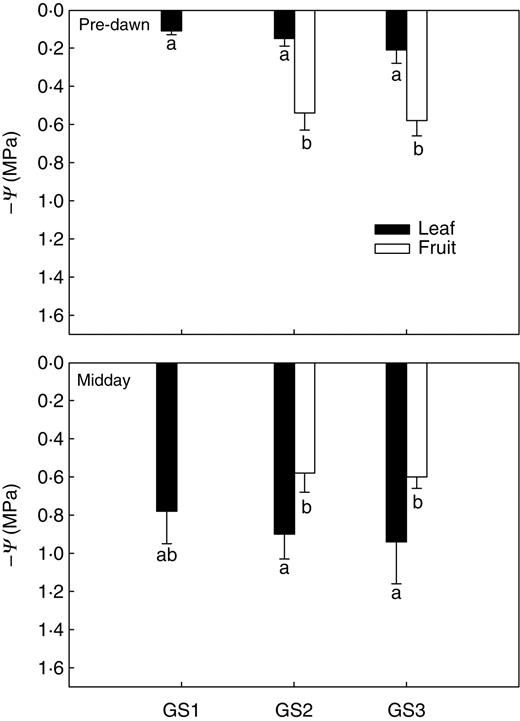
Leaf and fruit water potential (–Ψ) as measured at pre-dawn (A) and midday (B) on plants of Capsicum frutescens at three selected growth stages (GS1, GS2, GS3, see text). Means are given ± s.d. (n = 10). Different lower-case letters indicate significant differences for Tukey's pairwise comparisons (P < 0·001).
Osmotic potential at full turgor (−Ψπ0) and water potential at the turgor loss point (−ΨTLP) as measured on leaves and fruits of plants of Capsicum frutescens at three selected growth stages (GS1, GS2, GS3, see text)
| Leaf | Fruit | |||
|---|---|---|---|---|
| − Ψπ0 (MPa) | − ΨTLP (MPa) | − Ψπ0(MPa) | − ΨTLP (MPa) | |
| GS1 | 0·73 ± 0·06a | 1·12 ± 0·08bc | ||
| GS2 | 0·83 ± 0·07a | 1·13 ± 0·06bc | 1·25 ± 0·13cd | 1·55 ± 0·08ef |
| GS3 | 0·82 ± 0·024a | 1·10 ± 0·07bc | 1·35 ± 0·16de | 1·60 ± 0·18f |
| Leaf | Fruit | |||
|---|---|---|---|---|
| − Ψπ0 (MPa) | − ΨTLP (MPa) | − Ψπ0(MPa) | − ΨTLP (MPa) | |
| GS1 | 0·73 ± 0·06a | 1·12 ± 0·08bc | ||
| GS2 | 0·83 ± 0·07a | 1·13 ± 0·06bc | 1·25 ± 0·13cd | 1·55 ± 0·08ef |
| GS3 | 0·82 ± 0·024a | 1·10 ± 0·07bc | 1·35 ± 0·16de | 1·60 ± 0·18f |
Means are given ± s.d. (n = 5). Different lower-case letters indicate significant differences for Tukey's pairwise comparisons (P < 0·001).
Hydraulic measurements
The two techniques used for measuring leaf-specific hydraulic resistance (Rleaf), i.e. HPFM and VC techniques, gave fairly similar values for both GS1 and GS2 plants (about 0·05 mmol−1 s m2 MPa, Fig. 3A). By contrast, plants at GS3 showed Rleaf values about three-fold higher when measured using the VC compared with the HPFM technique. No changes of Rleaf or Rleaf blade were recorded throughout the study period using HPFM (Fig. 3B) with Rleaf blade accounting for about 80 % of Rleaf at all the growth stages studied.
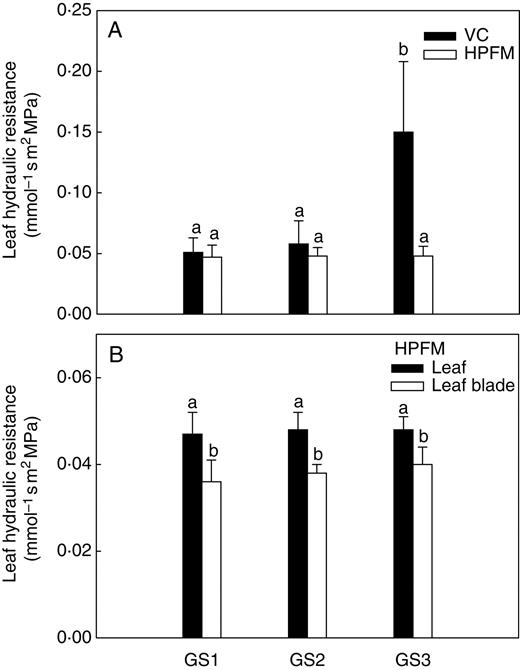
(A) Whole-leaf hydraulic resistance as measured using the vacuum chamber (VC) and the high-pressure flow meter (HPFM) and (B) whole-leaf hydraulic resistance and leaf blade hydraulic resistance as measured using the HPFM technique on plants of Capsicum frutescens at three selected growth stages (GS1, GS2, GS3, see text). Means are given ± s.d. (n = 10). Different lower-case letters indicate significant differences for Tukey's pairwise comparisons (P < 0·001).
Impairment of the vein network contributed most to the substantial increase of Rleaf as measured in GS3 plants (VC technique, Fig. 3A). FVD (Fig. 4A), in fact, was found to decrease by over 50 % in leaves of GS3 plants compared with GS2 and GS1 plants (from about 4 to 1·8 mm mm−2), indicating that the hydraulic efficiency of the vein network was strongly reduced in plants with ripe fruits. The impact of decreased FVD on leaf hydraulic resistance is shown in Fig. 4B. Here, a clear inverse relationship was found to exist between the two variables, with Rleaf increasing by over three-fold (from 0·05 to 0·18 mmol−1 s m2 MPa) for FVD decreasing from 3·5 to 1 mm mm−2.
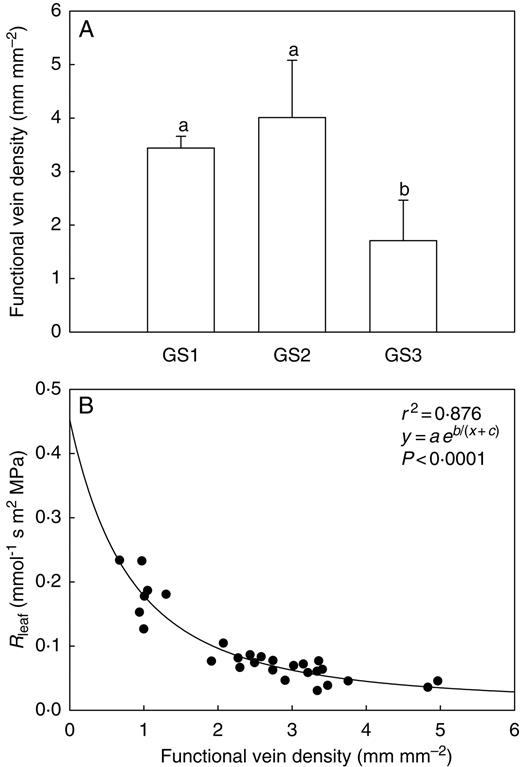
(A) Functional vein density measured on leaves of Capsicum frutescens plants at three selected growth stages (GS1, GS2, GS3, see text). Means are given ± s.d. (n = 10). Different lower-case letters indicate significant differences for Tukey's pairwise comparisons (P < 0·001). (B) Functional vein density as a function of leaf hydraulic resistance (Rleaf) as measured in Capsicum frutescens plants at three selected growth stages (GS1, GS2, GS3, see text). The equation of the curve, the coefficient of determination (r2) and the P-value are reported.
The HPFM and VC techniques gave similar results for the hydraulic resistivity of leaf petioles of plants at GS1 and GS2 (Fig. 5) and fruit peduncles (GS2, Fig. 5). By contrast, plants at GS3 showed significantly higher resistivities of petioles and peduncles when measured using the VC compared with the HPFM technique, i.e. 0·95 (VC) versus 0·7 mmol−1 s m−1 MPa (HPFM) for petioles and 0·8 (VC) versus 0·5 mmol−1 s m−1 MPa (HPFM) for peduncles. In other words, the VC technique measured resistivities between 30 and 40 % higher than the HPFM technique did in both plant regions. During plant growth (GS1 to GS2), the hydraulic resistivity of petioles decreased over 70 % (from about 1·3 to 0·3 mmol−1 s m−1 MPa) as a consequence of secondary growth (see below). Note that the same variable measured for peduncles of plants at GS2 was less than half that of petioles at the same growth stage. Plants at GS3 with visible, initial senescence of basal leaves and ripe fruits showed a substantial increase in the hydraulic resistivity of both petioles and peduncles even if at different absolute values depending on the technique used for measuring this variable.
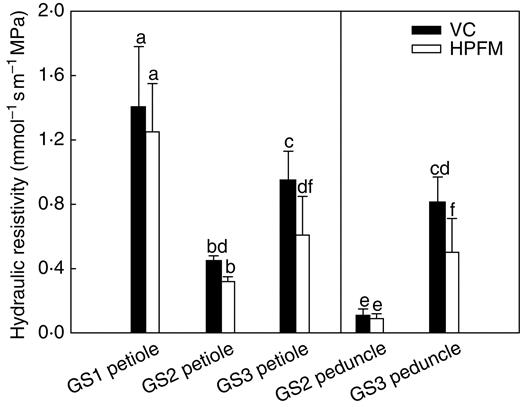
Hydraulic resistivity as measured using the vacuum chamber technique (VC) and the high-pressure flow meter (HPFM) on leaf petioles of Capsicum frutescens plants at three selected growth stages (GS1, GS2, GS3, see text) and on fruit peduncles (GS2 and GS3, see text). Means are given ± s.d. (n = 10). Different lower-case letters indicate significant differences for Tukey's pairwise comparisons (P < 0·001).
Anatomical measurements of xylem conduits of petioles and peduncles revealed that between GS1 and GS2 the number of conduits per section of leaf petioles increased by about 50 % (from 40 ± 4 to 63 ± 3 conduits per section, Table 3) corresponding to an increase in the potentially conductive cross-sectional area (Σπr2) of 90 %. This was due to a clear transition to secondary growth with new production of xylem conduits. The number of conduits per section was much larger in fruit peduncles (over 250 conduits per section), which resulted in a potentially conductive cross-sectional area about four-fold larger than that of petioles (GS2, Table 3) with a markedly visible secondary growth. The distribution of conduit diameters was approximately the same in the two plant regions (Table 4) so that the recorded differences in Σπr2 were clearly due to analogous differences in the number of conduits.
Number of xylem conduits per section and potentially conductive cross-sectional area (Σπr2 where r is the conduit radius) as measured in leaf petioles and fruit peduncles of plants of Capsicum frutescens at three selected growth stages (GS1, GS2, GS3, see text)
| Number of conduits per section | Σπr2 (×103, mm2) | ||
|---|---|---|---|
| Petiole | GS1 | 40 ± 4a | 5·9 ± 1·7a |
| GS2 | 63 ± 3b | 10·8 ± 1·4b | |
| GS3 | 67 ± 6b | 11·15 ± 2·9b | |
| Peduncle | GS2 | 251 ± 39a | 48·35 ± 6·1a |
| GS3 | 263 ± 42a | 43·27 ± 8·4a |
| Number of conduits per section | Σπr2 (×103, mm2) | ||
|---|---|---|---|
| Petiole | GS1 | 40 ± 4a | 5·9 ± 1·7a |
| GS2 | 63 ± 3b | 10·8 ± 1·4b | |
| GS3 | 67 ± 6b | 11·15 ± 2·9b | |
| Peduncle | GS2 | 251 ± 39a | 48·35 ± 6·1a |
| GS3 | 263 ± 42a | 43·27 ± 8·4a |
Means are given ± s.d. (n = 5). Within columns and for each plant region, different lower-case letters indicate significant differences for Tukey's pairwise comparisons (P < 0·001).
Xylem conduit diameter distribution as measured in leaf petioles and fruit peduncles of plants of Capsicum frutescens at the growth stage GS3 (see text)
| Xylem conduit diameter (μm) | Petiole (GS3) (%) | Peduncle (GS3) (%) |
|---|---|---|
| <10 | 9·1 ± 1·3a | 13·1 ± 7·6a |
| 10·1–20 | 78·6 ± 12·9b | 80·4 ± 4·1b |
| 20·1–30 | 8·2 ± 4·6a | 7·9 ± 2·8a |
| Xylem conduit diameter (μm) | Petiole (GS3) (%) | Peduncle (GS3) (%) |
|---|---|---|
| <10 | 9·1 ± 1·3a | 13·1 ± 7·6a |
| 10·1–20 | 78·6 ± 12·9b | 80·4 ± 4·1b |
| 20·1–30 | 8·2 ± 4·6a | 7·9 ± 2·8a |
Means are given ± s.d. (n = 5). Different lower-case letters indicate significant differences for Tukey's pairwise comparisons (P < 0·001).
DISCUSSION
The hydraulic architecture of hot pepper plants during the fruiting phase was clearly addressed to favour fruits for water supply. During growth, GS2 fruits did not compete with leaves for water supply because their water demand was mainly fulfilled in the night when ΨF was substantially more negative than ΨL (Fig. 2A), which allowed water to flow preferentially into fruits. This was made possible by: (1) solute accumulation in the fruits that developed more negative Ψπ0 compared with leaves, thus enhancing their driving force for water flow; and (2) the high number of xylem conduits (over 250 conduits per section, Table 3), which resulted in the very low resistivity of peduncles – about one-quarter that of petioles (Fig. 5).
The two hydraulic techniques used (HPFM and VC) gave similar results for leaves of GS1 plants and for leaves and fruits of GS2 plants (Fig. 3A), strongly suggesting that both petioles and peduncles of these plants were free from significant xylem embolism. In the warmest hours of the day, transpiring leaves of GS2 plants were sufficiently hydrated as indicated by their water potentials which still were within the turgor zone (Fig. 2). Fruits of GS2 plants maintained their high hydration status as well (Fig. 2) with the help of lowest diurnal water loss due to the absence of stomata, according to Lownds et al. (1993) so that fruit transpiration was merely cuticular. At midday, fruits of both GS2 and GS3 plants had higher ΨF (less negative) than ΨL (Fig. 2B). At first sight, this might question of how fruits could maintain higher water potentials than leaves in the absence of any hydraulic isolation from the parent plant. At ΨL < ΨF, water can be expected to flow out of fruits, which would result in dropping fruit water potentials. This did not occur in the present case. Note that the water potential of a fruit when still connected to the parent plant should equilibrate with the water potential of the adjacent xylem (Ψx). A simple calculation shows that this was the case. In fact, leaf hydraulic resistance (Rleaf, Fig. 3) as measured in GS2 plants using the VC technique was 0·058 ± 0·019 mmol−1 m2 s MPa and the corresponding ΨL was –0·9 ± 0·13 MPa. The transpiration rate at the same time of day (transpiration data are not reported) was 4·84 ± 0·7 mmol m−2 s−1. According to the hydraulic analogue of Ohm's law, the water potential drop (ΔΨ) between the leaf and xylem is given by the evaporative flow (E) multiplied by leaf hydraulic resistance (Rleaf). On the basis of the above, it can be calculated that ΔΨ was 0·28 MPa. At midday, ΨF was about 0·3 MPa less negative that ΨL (Fig. 2). Hence, the higher diurnal water potentials of fruits (–0·6 MPa) compared with ΨL (–0·9 MPa) were probably the result of the equilibration of ΨF to Ψx. During fruit ripening phloem unloading can be expected to increase, driving solutes into the apoplast. This may influence recordings of fruit water potential when measured using the pressure chamber. Therefore, the possibility that fruit water potentials were underestimated in the present study cannot be ruled out. Further studies including a more extended comparison between different techniques for measuring fruit water potential during development and ripening are clearly needed.
Some studies have suggested that phloem delivers water to fruit dominantly during the last phase of fruit ripening while xylem conductance progressively declines (e.g. Ho et al., 1987; Lang, 1990; Greenspan et al., 1996; Dichio et al., 2003; Drazeta et al., 2004). Phloem-derived water flows, therefore, would represent a sort of ‘hydraulic buffer’ for fruits (Choat et al., 2009). In the present case, the homeostasis of fruit water status was ensured with no need of special hydraulic buffering or water supply from other sources (Rogiers et al., 2001; Bondada et al., 2005). Equilibration of ΨF to ΨL implies low hydraulic resistivity at the water inlet into fruits (peduncles). This was the case because GS2 plants showed very low hydraulic resistivity of peduncles (Fig. 5).
Xylem occlusion or disruption at fruit-to-plant junctions during fruit ripening has been documented, leading to fruit hydraulic isolation from the parent plant, possibly preventing fruit dehydration (e.g. Düring et al., 1987; Malone and Andrews, 2001; Rogiers et al., 2001; Tyerman et al., 2004). No xylem disruption was observed in the course of our anatomical observations of fruit peduncles of GS3 plants, in accordance with similar conclusions by Tyerman et al. (2004), Bondada et al. (2005), Keller et al. (2006), and Tilbrook and Tyerman (2008). Substantial increases in leaf petiole and fruit peduncle resistivities were recorded in GS3 plants irrespective of the hydraulic technique used. Because the HPFM technique implies the complete filling of all xylem conduits free from solid occlusions, the present data strongly suggest that part of the measured increase in resistivity was due to xylem clogging in both plant regions. The VC technique measured even higher resistivity of leaf petioles and fruit peduncles of GS3 plants than the HPFM technique (by over 40 %). This additional fraction of resistivity was apparently due to conduit embolism (Kolb et al., 1996; Trifilò et al., 2003; Lo Gullo et al., 2005). It is well known that embolized conduits are subsequently blocked by tyloses (outgrowths of vessel-associated cells). During the present anatomical observations, numerous conduits appeared to contain tyloses. The solid occlusion of conduits of hot pepper plants as measured by the HPFM technique, therefore, might well be a secondary consequence of conduit embolism. Recent studies (e.g. Mut et al., 2008) have reported changes in aquaporin expression/activity during fruit ripening. This means that changes in both extravascular and vascular fruit hydraulic resistance might either compensate for or exacerbate the decline in the hydraulic resistance of fruit peduncles as recorded in the present study. Further investigations are needed that take into account all possible components of fruit hydraulic architecture.
Diurnal changes in petiole hydraulic conductivity (Kpetiole = 1/Rpetiole) have been reported for red maple and tulip tree by Zwieniecki et al. (2000) as related to leaf water potentials developing under water stress. The resistivity of petioles of GS3 plants increased by similar amounts to those reported by the above authors at comparable leaf water potentials. Tyree et al. (1993) have argued that petioles are very sensitive to cavitation. In the present experiments, plants were maintained well watered throughout the study period and ΨL was never more negative than –1·10 MPa. The 50 % decrease in FVD suffered by GS3 plants (Fig. 4) was probably the result of petiole cavitation, although the opposite might equally be plausible according to Choat et al. (2005) who found that petioles were more resistant to cavitation than the vein network. Note, however, that because Rpetiole represented only about 20 % of Rleaf (Fig. 4), even a 100 % increase in Rpetiole cannot explain the three- to four-fold increase in Rleaf measured by the VC technique for leaves at GS3. On the basis of our data, we suggest that xylem cavitation/embolism was the primary cause of the impairment of both leaf and fruit xylem.
To the best of our knowledge, the present work represents the first attempt to determine the hydraulics of leaves and fruits during growth and maturation through direct, simultaneous measurements of water status and xylem efficiency of both plant regions at different times of the day. Two novel aspects of fruit physiology emerge: (1) fruits of irrigated hot pepper plants were able to maintain high levels of hydration during ripening with no need for extraxylary water sources; and (2) the common trait of initiating functional separation of leaves and fruits from the parent plant appeared to be cavitation-induced xylem embolism. We cannot explain why xylem conduits of peduncles were induced to cavitate given the low diurnal evaporation rates of the fruits and water potentials well above the turgor loss point. The final developmental phase of the plant may possibly induce partial enzymatic digestion of the intervessel pit membranes with consequent enlargement of pit membrane pores, which would substantially lower the cavitation threshold of conduits (Raimondo et al., 2003; Gascò et al., 2006). This hypothesis is supported by recent literature reporting several pectin-digesting enzymes in xylem sap of different species, such as polygalacturonases and glucanases which de-polymerize galacturonic chains of pectic compounds that are principal components of pit membranes (Markovič and Janeček, 2004; Alvarez et al., 2006, 2008; Djordjevic et al., 2007). The entire process of hydraulic isolation of ripe fruits as well as leaf senescence has and continues to receive much attention. The present insights into xylem physiology open new horizons to future research requiring closer integration between biophysical and molecular approaches.
